Now that we have set up the Viewer configuration, imagery, and terrain for our application, we can add the main focus of our application – geocache data.
For visualization convenience, Cesium supports the popular vector formats GeoJSON and KML, as well as a format our team open-sourced called CZML, which we specifically developed for describing Cesium scenes.
Regardless of the initial format, all spatial data in Cesium is represented using the Entity API. The Entity API provides an efficient and flexible visualization method for Cesium rendering. A Cesium Entity is a data object that can be paired with styled graphical representations and positioned in space and time. Many simple Entity examples are provided in the test sandbox. To get up to speed on the Entity API, take a break from this application and read the Visualizing Spatial Data tutorial.
Here are some examples of different entity types:
Once you understand what an Entity looks like, loading datasets with Cesium becomes easy to understand. To read a data file, you need to create a DataSource appropriate for the data format, which will parse the data file hosted at the specified URL and create an EntityCollection containing an Entity for each geospatial object in the dataset. DataSource just defines an interface – the exact type of data source you need will depend on the data format. For example, KML uses KmlDataSource:
| |
The above code reads our sample geocache points from a KML file, calling KmlDataSource.load(options) with some configuration. For a KmlDataSource, the camera and canvas options are required. The clampToGround option enables ground clamping, a popular configuration for making ground geometry entities like polygons and ellipses conform to terrain rather than following the WGS84 ellipsoid surface.
Since this data is loaded asynchronously, KmlDataSource returns a Promise that will contain all our newly created entities.
If you’re not familiar with the Promise API for asynchronous functions, “asynchronous” here basically means you should do what you need with the data in the provided callback function using .then. To actually add this entity collection to the scene, we must wait until the promise is resolved, then add the KmlDataSource to viewer.dataSources:
| |
By default, these newly created entities have useful features. Clicking will display an Infobox with metadata related to the entity, and double-clicking will zoom to and view the entity. To stop viewing that entity, click the “home” button, or click the “fly out” camera icon on the Infobox. Next, we’ll add custom styling to improve our application’s appearance.
For KML and CZML files, declarative styles can be established within the file. However, for this application, let’s practice manually styling our entities. To do this, we’ll take an approach similar to this styling example, waiting for our data source to load, then iterating through all entities in the data source collection, modifying and adding properties. By default, our geocache point markers are created as Billboards and Labels, so to modify the appearance of these entities, we do this:
| |
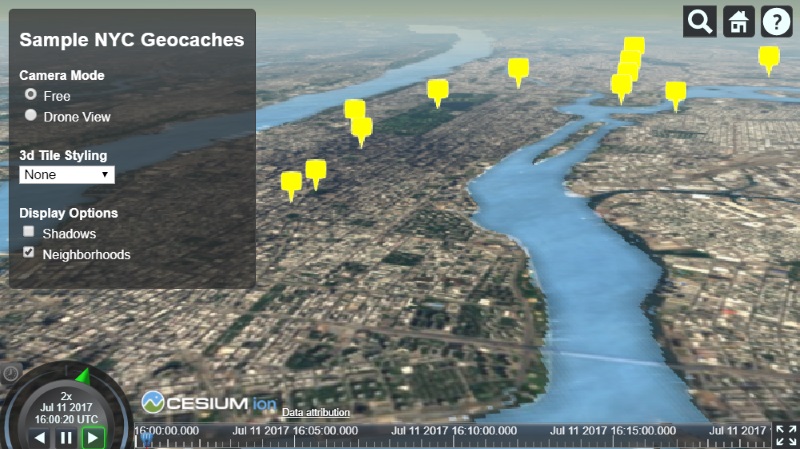
We can improve the appearance of the markers by adjusting their anchor points, removing labels to reduce clutter, and setting a distanceDisplayCondition so that only points within a certain distance from the camera are visible.
| |
For more help on distanceDisplayCondition, see the sandcastle example.
Next, let’s improve the Infobox for each geocache entity. The Infobox title is the entity name, and the content is the entity description, displayed as HTML.
You’ll notice the default description isn’t very helpful. Since we’re displaying geocache locations, let’s update them to show the longitude and latitude of each point.
First, we convert the entity’s position to cartographic, then read the longitude and latitude from the Cartographic and add them to the description in an HTML table.
When clicked, our geocache entities will now display a well-formatted Infobox with just the data we need.
| |
Our geocache markers should now look like this:
For our geo application, it would also be helpful to visualize the neighborhoods of specific points. Let’s try loading a GeoJSON file containing polygons for each New York neighborhood. Loading GeoJSON files is very similar to the loading process we just used for KML. But in this case, we use GeoJsonDataSource. Like the previous data source, we need to add it to viewer.dataSources to actually add the data to the scene.
| |
Let’s adjust the loaded neighborhood polygons. Just like the billboard styling we just did, we first iterate through the neighborhood data source entities after the data source loads, this time checking if each entity’s polygon is defined:
| |
Since we’re displaying neighborhoods, let’s rename each entity to use the neighborhood as its name. The neighborhood from the original GeoJSON file is stored as a property. Cesium stores GeoJSON properties in entity.properties, so we can set the neighborhood name like this:
| |
Instead of making all neighborhoods the same color, we can assign each polygon a new color material with a random color using ColorMaterialProperty and Color.
| |
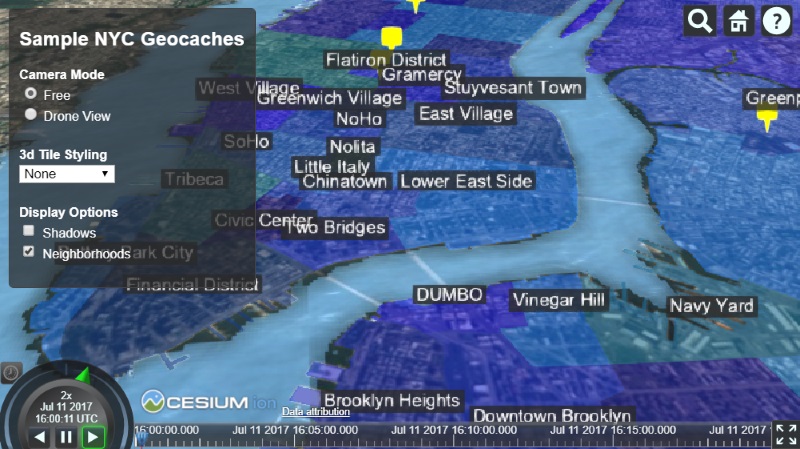
Finally, let’s generate a Label with some basic styling options for each entity. To keep things clean, we can use disableDepthTestDistance to make Cesium always render the labels above any 3D objects that might occlude them.
However, note that labels are always positioned at entity.position. A Polygon is created with an undefined position because it has a list of positions defining the polygon boundary. We can generate a position by taking the center of the polygon positions:
| |
This gives us labeled polygons that look like this:
Finally, let’s add a high-tech perspective to our NYC geocaches by adding a drone flight over the city.
Since the flight path is just a series of positions over time, we can add this data from a CZML file. CZML is a format for describing time-dynamic graphical scenes, primarily for display in web browsers running Cesium. It describes lines, points, billboards, models, and other graphical primitives, and specifies how they change over time. CZML is to Cesium what KML is to Google Earth – a standard format that allows most Cesium features to be used through a declarative styling language (in this case, a JSON schema).
Our CZML file defines an entity (visualized as a point by default) whose position is defined as a series of positions at different time points. There are several property types available in the Entity API for handling time-dynamic data. See the demo example below:
| |
The CZML file uses Cesium to display a drone flight. The path is a property that shows the entity’s position over time. A path visualizes discrete points connected into a continuous line using interpolation. Finally, let’s improve the appearance of the drone flight. First, instead of simply displaying a point, we can load a 3D model to represent our drone and attach it to the entity.
Cesium supports loading 3D models based on glTF (GL Transmission Format), an open specification developed by the Cesium team together with the Khronos Group, designed to efficiently load 3D models for applications by minimizing file size and runtime processing. Don’t have a glTF model? We provide an online converter to convert COLLADA and OBJ files to glTF format.
Let’s load a drone Model with nice physically-based shading and some animations:
| |
Now our model looks good, but unlike the original point, the drone model has a direction, and it looks strange when the drone moves forward without orientation. Fortunately, Cesium provides a VelocityOrientationProperty, which automatically calculates orientation based on positions sampled before and after the entity:
| |
Now our drone model will behave as expected.
One more thing we can do to improve the appearance of our drone flight: from a distance, it may not be obvious, but the drone’s path is made up of line segments that look unnatural. This is because Cesium uses linear interpolation by default to construct the path from sampled points. However, interpolation options can be configured.
For a smoother flight path, we can change the interpolation options like this:
| |

Cesium Chinese Community QQ Group: 807482793
Original link: http://cesiumcn.org/topic/161.html | China fast access: http://cesium.coinidea.com/topic/161.html