Cesium Chinese Website: http://cesiumcn.org/ | Fast Domestic Access: http://cesium.coinidea.com/
With travel restrictions from Europe to the United States taking effect today, and with increasing encouragement for people to stay home to slow the spread of the coronavirus, we were curious how these measures are affecting global travel. Naturally, we used Cesium to explore.
We began collecting flight data every other day over the past few months. Here are all the flights in and out of Beijing’s main international airport:
 [The number of scheduled flights at Beijing Capital International Airport (PEK) visualized over time. Departures are shown in red, arrivals in green.]
At the end of January, the number of flights dropped sharply, from about 900 flights rapidly down to fewer than 300. This coincided with the World Health Organization (WHO) declaring a global health emergency and the United States and other countries restricting travel from China.
Following China, Italy was severely affected by the coronavirus. The first reported case occurred on February 22, cases surged rapidly, and the Italian government implemented a quarantine on March 8. We can see flight traffic declining there, though not as rapidly:
 [Flights in and out of Rome’s Leonardo da Vinci-Fiumicino Airport (FCO) in Italy.]
As of the time of writing, flights in London had not been subject to any official restrictions, but scheduled flights for the remainder of March still showed a significant decline. We marked all US flights in red.
 [Flights in and out of London Heathrow Airport.]
Finally, here is JFK Airport in New York City, one of the largest air traffic hubs in the United States. So far, there didn’t appear to be any significant changes:
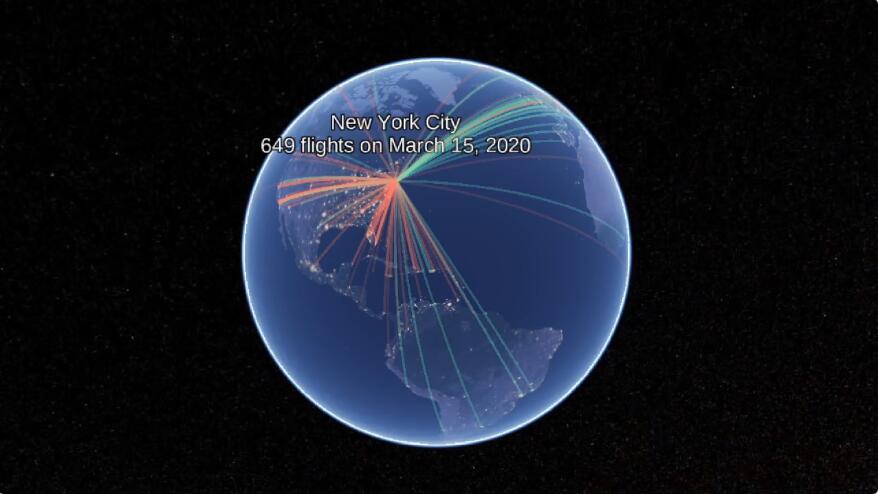 [Flights in and out of New York’s John F. Kennedy International Airport.]
How We Created These Visualizations
Flight data was obtained from AeroDataBox. Their API takes an airport code parameter and returns all flights in and out of that airport within a given time period.
Once we had these scheduled routes, we used open data from OpenFlights to get the location of each airport.
Finally, we created a CZML that draws a line for each route with a timestamp, and visualized the routes over time using Cesium Stories.
If readers want to create something similar, we recommend starting with the Cesium Stories time-dynamic data tutorial.
Original author: Omar Shehata
Link: https://cesium.com/blog/2020/03/13/covid-19-flight-impact/
Cesium Chinese Website QQ Group: 807482793
Cesium Chinese Website: http://cesiumcn.org/ | Fast Domestic Access: http://cesium.coinidea.com/