Cesium Chinese Website: http://cesiumcn.org/ | China Fast Access: http://cesium.coinidea.com/
Camptocamp has added underground visualization capabilities to swisstopo’s digital twin.
Free Public Access to Switzerland’s 3D Map
Based on 3D Tiles, the Swiss Federal Geoportal 3D Viewer provides free access to an interactive nationwide map, including terrain, bridges, buildings, and even trees – over 70 million objects.
Camptocamp has implemented these new features in swissgeol, swisstopo’s web-based 3D geological data viewer. 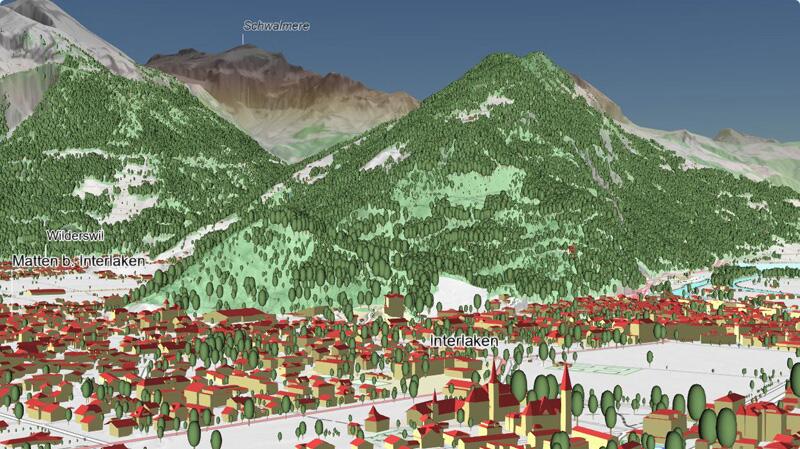
The swisstopo 3D portal is an interactive map of Switzerland, including both natural and built environments.
While this 3D map is impressive, it didn’t provide a complete picture of the country: groundwater, mineral layers, basements, parking garages, subways, and other underground parts of buildings were all missing.
Looking Underground
The Swiss Federal Office of Topography wanted to show not only what’s above ground in Switzerland, but also what’s below. Therefore, in collaboration with Camptocamp, we added support for underground visualization in CesiumJS 1.70.
Swissgeol brings together a wealth of underground datasets, including boreholes, seismic data, and bedrock maps. These data were previously separate and two-dimensional, but by combining them, swissgeol gives users a more complete view of the subsurface.

Underground boreholes in swissgeol, along with buildings, terrain, and imagery data on the surface.
All this data streams smoothly to the browser thanks to 3D Tiles and Cesium ion’s 3D pipelines. Camptocamp uses FME, geological 3D modeling packages, and Python to preprocess the data.
Users can adjust the transparency of each layer, including the surface imagery, and can also view cross-sections.
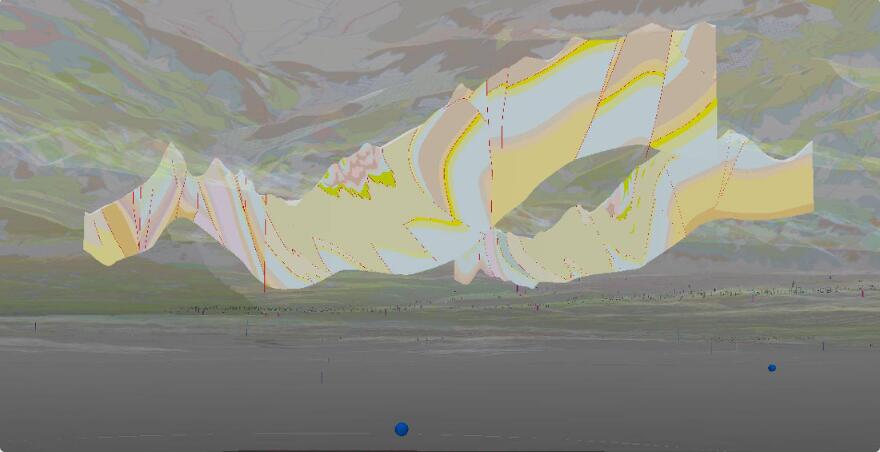
Cross-section data with transparent terrain and surface imagery in swissgeol.
Geological Data at Work
The viewer is freely available to the public and will serve many needs in the geological field. Geological engineers will be able to analyze potential projects such as transport tunnels and perform risk analysis for events like rock slides. Decision-makers will have better base data for education or for selecting suitable project sites.
For example, although approximately 75% of Switzerland’s energy currently comes from imported fossil fuels, their new energy policy “Energy Strategy 2050” aims to increase reliance on local shallow geothermal energy.
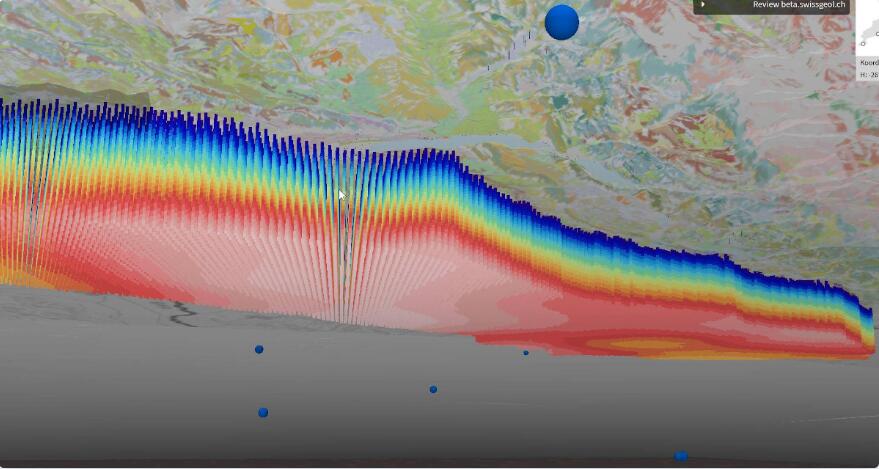
Geothermal datasets visualized in swissgeol.
Until now, creating a geothermal project proposal required gathering all the different datasets, such as geological maps, boreholes, cross-sections, 3D models, seismic data, and more. Each dataset had to be copied and stored separately, or database connections had to be established using GIS or 3D modeling software. Datasets could only be visualized in 2D or in model-based 3D. Swissgeol greatly simplifies this process by bringing all datasets together in a single portal that can be shared instantly.
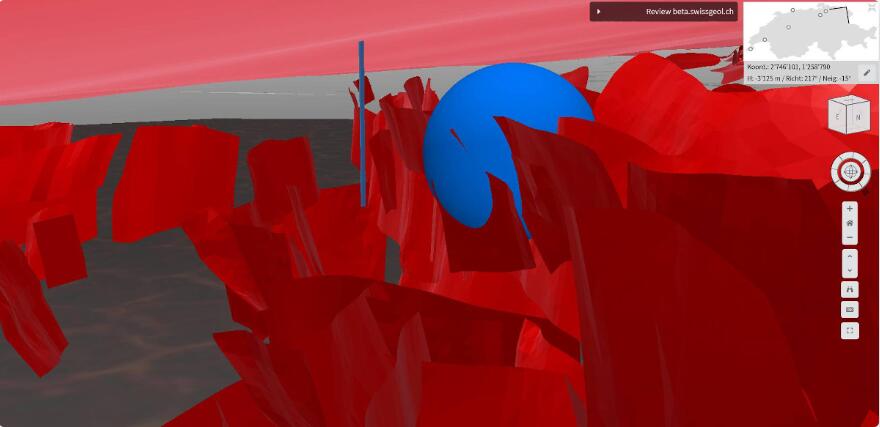
Visualization of deep geothermal wells with complex fault patterns and seismic locations.
Future Outlook
Swissgeol is currently in beta. In the future, swisstopo and Camptocamp plan to add features including picking and styling, so that relevant attributes of the data can be queried, filtered, analyzed, and downloaded. Registered users who need additional functionality, including swisstopo’s own users, will also be able to access other features such as uploading/downloading user-generated data and creating closed user groups to share sensitive data with a limited number of users.
If you have underground data, you can visualize it alongside all your other 2D and 3D data by uploading it to Cesium ion.
Author: Sarah Chow
Original link: https://cesium.com/blog/2020/07/06/camptocamp-underground-visualization-with-cesium/
Comment: The underground visualization based on Cesium that everyone has been hoping for is becoming increasingly mature.
Cesium Chinese Website QQ Group: 807482793
Cesium Chinese Website: http://cesiumcn.org/ | China Fast Access: http://cesium.coinidea.com/