Cesium Chinese Website: http://cesiumcn.org/ | Fast Domestic Access: http://cesium.coinidea.com/
Cesium can be used to visualize data that changes over time, whether it’s geological changes spanning hundreds of years or satellite orbits that need to be tracked down to fractions of a second. As part of the official launch of Cesium Stories, we are pleased to announce improved support for time-dynamic data, so you can drag and drop dynamic KML or CZML to create interactive stories that visualize changing data.
This is a great way to review collected drone flight and telemetry data over time, as you can see the drone’s path – across the entire world.
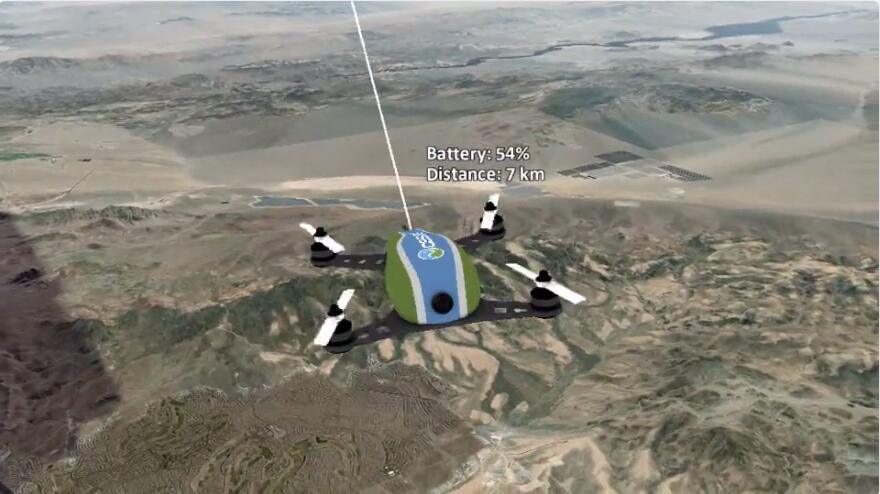
With Cesium Stories, we can review drone flight data alongside the surrounding landscape and view collected time-series telemetry data.
Alternatively, if you perform offline analysis in tools like STK, you can export your work as CZML and easily share it with a link.
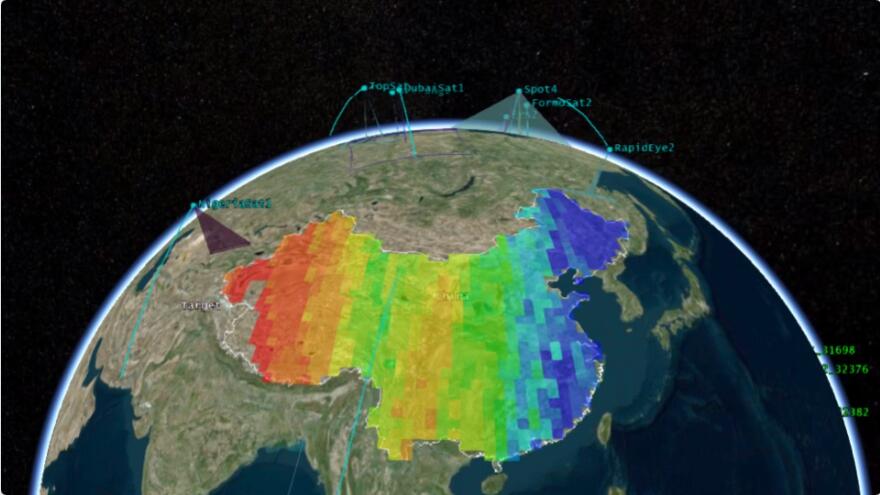
Satellite coverage calculated by STK (System Tool Kit) and exported to Cesium Stories as a CZML file.
Time-dynamic data doesn’t have to be objects moving over time. Our users have also plotted housing prices, disease outbreaks, and changing terrain maps.

Cesium Stories also supports dynamic KML files. This image shows the annual ice surface melt in Greenland from 1979 to 2007. Data from the National Snow and Ice Data Center.
Cesium Stories makes it easy to view and share your time-dynamic data, giving you control over playback speed and camera movement. Try it out with our new time-dynamic data tutorial. Or see what else you can do with Stories.
Original link: https://cesium.com/blog/2020/03/04/time-dynamic-stories/
Author: Omar Shehata
Cesium Chinese Website QQ Group: 807482793
Cesium Chinese Website: http://cesiumcn.org/ | Fast Domestic Access: http://cesium.coinidea.com/